Joins
Remember to:
- display a fully joined version of the Portal data using:
portal_bigtable <- inner_join(inner_join(surveys, species), plots)
Why use multiple tables
- When we talked about data structure we discussed splitting data into multiple tables.
- This is because it is not efficient to include all information in a single table.
- Redundant information makes it more difficult to update or revise data.
- Using multiple tables allows us to make changes in one place, not hundreds of places.
- For example, if the taxonomy changes for a species in our study and we worked with one big table, we would need rather change the name hundreds or thousands of times.
- We avoid redundancy by using multiple tables
- Each table contains a single kind of information
- In the Portal dataset we’ve been using
surveys: information about individualsspecies: information about speciesplots: information about plots
- If a species name changes we only need to change it in the
speciestable - Connect tables using joins to describe relationships between tables
- To enable us to make these connections the tables need one or more columns that link them together
- In the case of the Portal data there is one column that links the
surveysandspeciestables,species_id - There is also one column that links the
surveysandplotstables,plot_id
Basic join
- Joins combine two tables using one or more columns
- Let’s start by loading the data from all three tables in the Portal dataset
library(dplyr)

surveys <- read.csv("surveys.csv")
species <- read.csv("species.csv")
plots <- read.csv("plots.csv")
- Now let’s join the surveys and the species tables together
- We’ll use an “inner join”
- To do this we use the
inner_joinfunction - It takes three arguments:
- The first of the two tables we want to join
- The second of the two tables we want to join
- And the column, or columns, that provide the linkage between the two tables
combined <- inner_join(surveys, species, by = "species_id")
- Looking at the
combinedtable, we can see that on every row with a particular value forspecies_idthe join has added the matching values ongenus,species, andtaxa - So one way to think about this join is that it adds the relevant information in the
speciestable to thesurveystable -
Often for scientific data we can think about there being one main table, the
surveystable in our case, and multiple supplementary tables that provide additional details - Inner joins keep information from both tables when both tables have a matching value in the join column
- Here’s a visualization of what an inner join looks like:
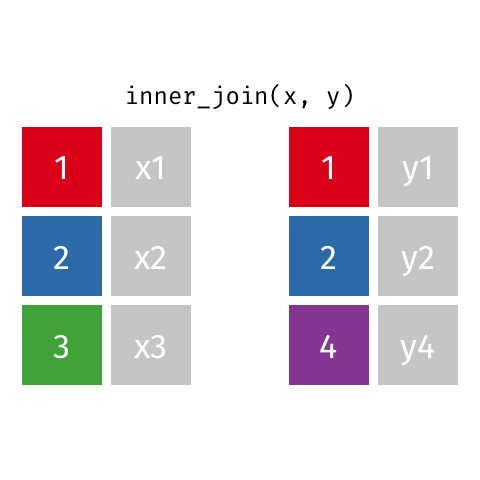
- Any rows in either table that don’t have a matching value in the other table are dropped
- So when we did our join all of the rows with missing
species_idvalues were dropped - There are other joins that behave differently
- Left joins keep all rows in the first, or left, table
- So if we want to keep rows with missing species IDs we could use
left_join
combined <- left_join(surveys, species, by = "species_id")
- There are also right joins, which keep all rows in the second, or right, table
- And outer joins, which keep all rows from both tables
- For our exercises we’ll focus on using inner joins
Multi-table join
- In our last video we learned about how to join two tables together
- But we often need to combine more than two tables
- In the case of the Portal data we might need information from both the
speciesandplotstables to be combined with thesurveystable - To join more than two tables we start by joining two tables
- And then join the resulting table to a third table, and so on
- So, for Portal, we could start by joining the
surveysand thespeciestables
survey_species <- inner_join(surveys, species, by = "species_id")
- And then join this
combinedtable and theplotstable
portal_full <- inner_join(survey_species, plots, by = "plot_id")