Species Occurrences Map (Spatial Data)
A colleague of yours is working on a project on banner-tailed kangaroo rats (Dipodomys spectabilis) and is interested in what elevations these mice tend to occupy in the continental United States. You offer to help them out by getting some coordinates for specimens of this species and looking up the elevation of these coordinates.
Start by getting banner-tailed kangaroo rat occurrences from GBIF, the Global
Biodiversity Information Facility, using the spocc R
package, which is designed to retrieve species occurrence data from various
openly available data resources. Use the following code to do so:
```
dipo_df = occ(query = "Dipodomys spectabilis",
			from = "gbif",
			limit = 1000,
			has_coords = TRUE)
dipo_df = data.frame(dipo_df$gbif$data)
```
- Clean up the data by:
- Filter the data to only include those specimens with
Dipodomys_spectabilis.basisOfRecordthat isPRESERVED_SPECIMENand aDipodomys_spectabilis.countryCodethat isUS - Remove points with values of
0forDipodomys_spectabilis.latitudeorDipodomys_spectabilis.longitude - Remove all of the columns from the dataset except
Dipodomys_spectabilis.latitudeandDipodomys_spectabilis.longitudeand rename these columns tolatitudeandlongitudeusingselect. You can rename while selecting columns using a format like this oneselect(new_column_name = old_column_name) - Use the
head()function to show the top few rows of this cleaned dataset
- Filter the data to only include those specimens with
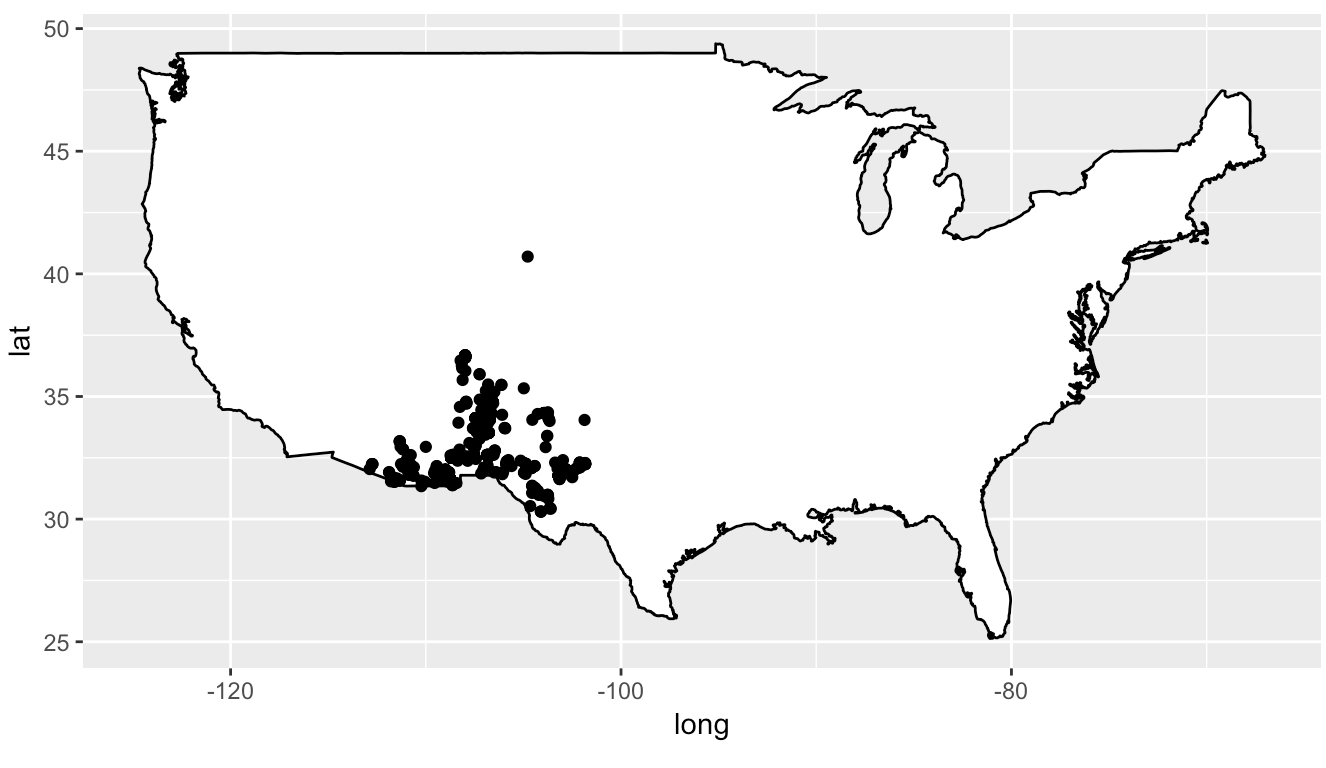
- Do the following to display the locations of these points on a map of the United States:
- Get data for a US map using
usmap = map_data("usa") - Plot it using
geom_polygon. In the aesthetic usegroup = groupto avoid weird lines cross your graph. Usefill = "white"andcolor = "black". - Plot the kangaroo rat locations
- Use
coord_quickmap()to automatically use a reasonable spatial projection
- Get data for a US map using