Learning Objectives
Following this assignment students should be able to:
- understand the basic plot function of
ggplot2- import ‘messy’ data with missing values and extra lines
- execute and visualize a regression analysis
Reading
Lecture Notes
Exercises
Bird Banding Multiple Vectors (optional)
El número de aves anilladas en unos sitios de muestreo ha sido contado por su equipo de campo e ingresado en el siguiente vector. Los conteos se ingresan en el orden pertinente al sitio de muestreo, es decir, la posición 1 del vector corresponde a los pájaros contados en el sitio de conteo 1. Un segundo vector contiene información sobre la cantidad de árboles en cada sitio de muestreo. Corte y pegue el vector en su tarea y responda las siguientes preguntas usando funciones predeterminadas. Imprima el resultado a la pantalla.
number_of_birds <- c(28, 32, 1, 0, 10, 22, 30, NA, 145, 27, 36, 25, 9, 38, 21, 12, 122, 87, 36, 3, 0, 5, 55, 62, 98, 32, 900, 33, 14, 39, 56, 81, 29, 38, 1, 0, 143, 37, 98, 77, 92, 83, 34, 98, 40, 45, 51, 17, 22, 37, 48, NA, 91, 73, 54, 46, 102, 273, 600, 10, 11) number_of_trees <- c(10, 12, 2, 3, 10, 8, 19, 19, 14, 3, 4, 5, 8, 4, 8, 1, 12, 10, 3, 1, 2, 3, 5, 6, 8, 2, 90, 3, 4, 3, 6, 8, NA, 4, 0, 1, 14, 3, 10, NA, 9, 8, 4, 8, 4, 4, 5, 1, 2, 3, 5, 4, 10, 7, 5, 8, 10, 30, 26, 1, 6)- ¿Cuántos sitios de muestreo hay?
- ¿Cuántas aves se contaron en el sitio de muestreo 26?
- ¿Cuál es el mayor número de aves contadas?
- ¿Cuál es el número promedio de aves contadas?
- ¿Cuál es el número total de árboles contados en todos los sitios de muestreo?
- ¿Cuál es el menor número de árboles contados?
- Produzca un vector que contenga los conteos de aves en sitios de muestreo con al menos 10 árboles.
- Produzca un vector que contenga el número de árboles contados en sitios de muestreo con al menos 10 árboles.
- Combine los vectores
number_of_birdsynumber_of_treesen un dataframe (marco de datos) como columnas. Incluya una tercera columna de año, llamadayear, con el año 2012 en cada fila, finalmente incluya una cuarta columna de sitio de conteo, llamadasite, que contenga los números del 1 al 61.
Bird Banding Multiple Vectors (optional)
The number of birds banded at a series of sampling sites has been counted by your field crew and entered into the following vector. Counts are entered in order and sites are numbered starting at one. There is also information on the number of trees at each site. Cut and paste the vector into your assignment and then answer the following questions by using code and printing the result to the screen.
number_of_birds <- c(28, 32, 1, 0, 10, 22, 30, NA, 145, 27, 36, 25, 9, 38, 21, 12, 122, 87, 36, 3, 0, 5, 55, 62, 98, 32, 900, 33, 14, 39, 56, 81, 29, 38, 1, 0, 143, 37, 98, 77, 92, 83, 34, 98, 40, 45, 51, 17, 22, 37, 48, NA, 91, 73, 54, 46, 102, 273, 600, 10, 11) number_of_trees <- c(10, 12, 2, 3, 10, 8, 19, 19, 14, 3, 4, 5, 8, 4, 8, 1, 12, 10, 3, 1, 2, 3, 5, 6, 8, 2, 90, 3, 4, 3, 6, 8, NA, 4, 0, 1, 14, 3, 10, NA, 9, 8, 4, 8, 4, 4, 5, 1, 2, 3, 5, 4, 10, 7, 5, 8, 10, 30, 26, 1, 6)- How many sites are there?
- How many birds were counted at the 26th site?
- What is the largest number of birds counted?
- What is the average number of birds seen at a site?
- What is the total number of trees counted across all of the sites?
- What is the smallest number of trees counted?
- Produce a vector with the number of birds counted on sites with at least 10 trees.
- Produce a vector with the number of trees counted on sites with at least 10 trees.
- Combine the
number_of_birdsandnumber_of_treesvectors into a dataframe that also includes a year column with the year 2012 in every row and site column containing the numbers 1 through 61.
Portal Data Review (optional)
If
surveys.csv,species.csv, andplots.csvare not available in your workspace download them:Load them into R using
read.csv().- Create a data frame with only data for the
species_idDO, with the columnsyear,month,day,species_id, andweight. - Create a data frame with only data for species IDs
PPandPBand for years starting in 1995, with the columnsyear,species_id, andhindfoot_length, with no null values forhindfoot_length. - Create a data frame with the average
hindfoot_lengthfor eachspecies_idin eachyearwith no null values. - Create a data frame with the
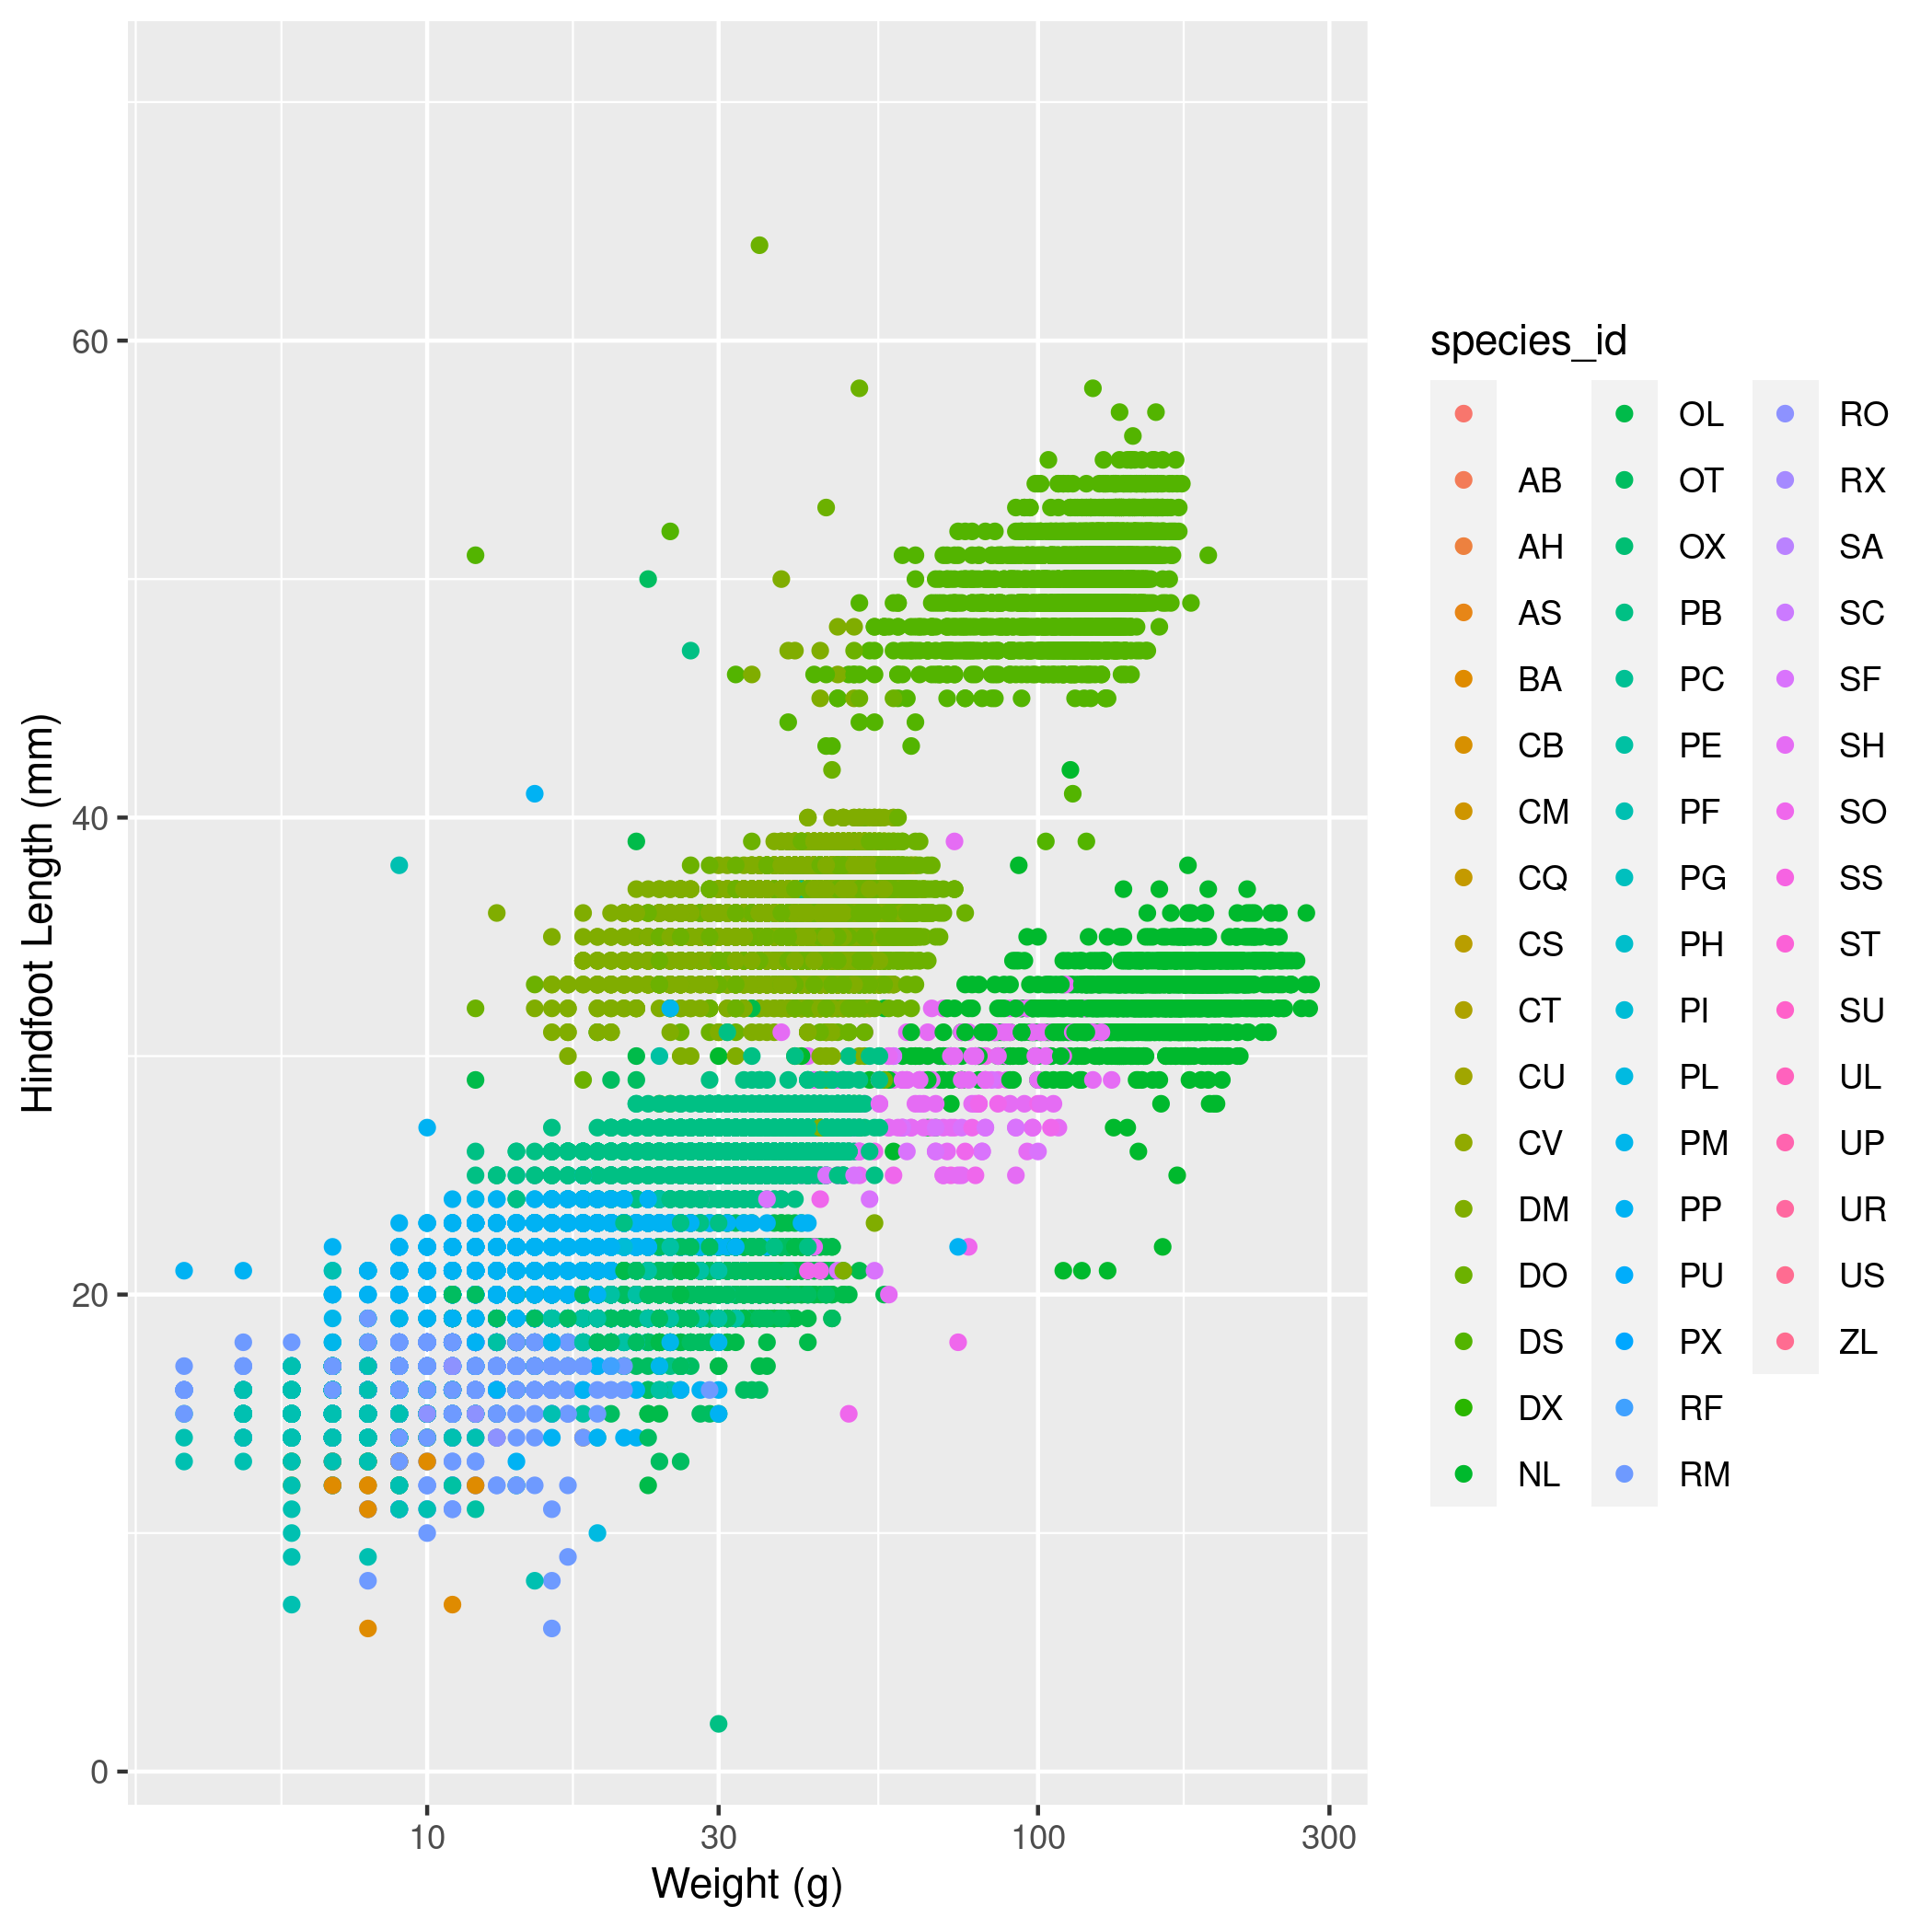
year,genus,species,weightandplot_typefor all cases where thegenusis"Dipodomys". - Make a scatter plot with
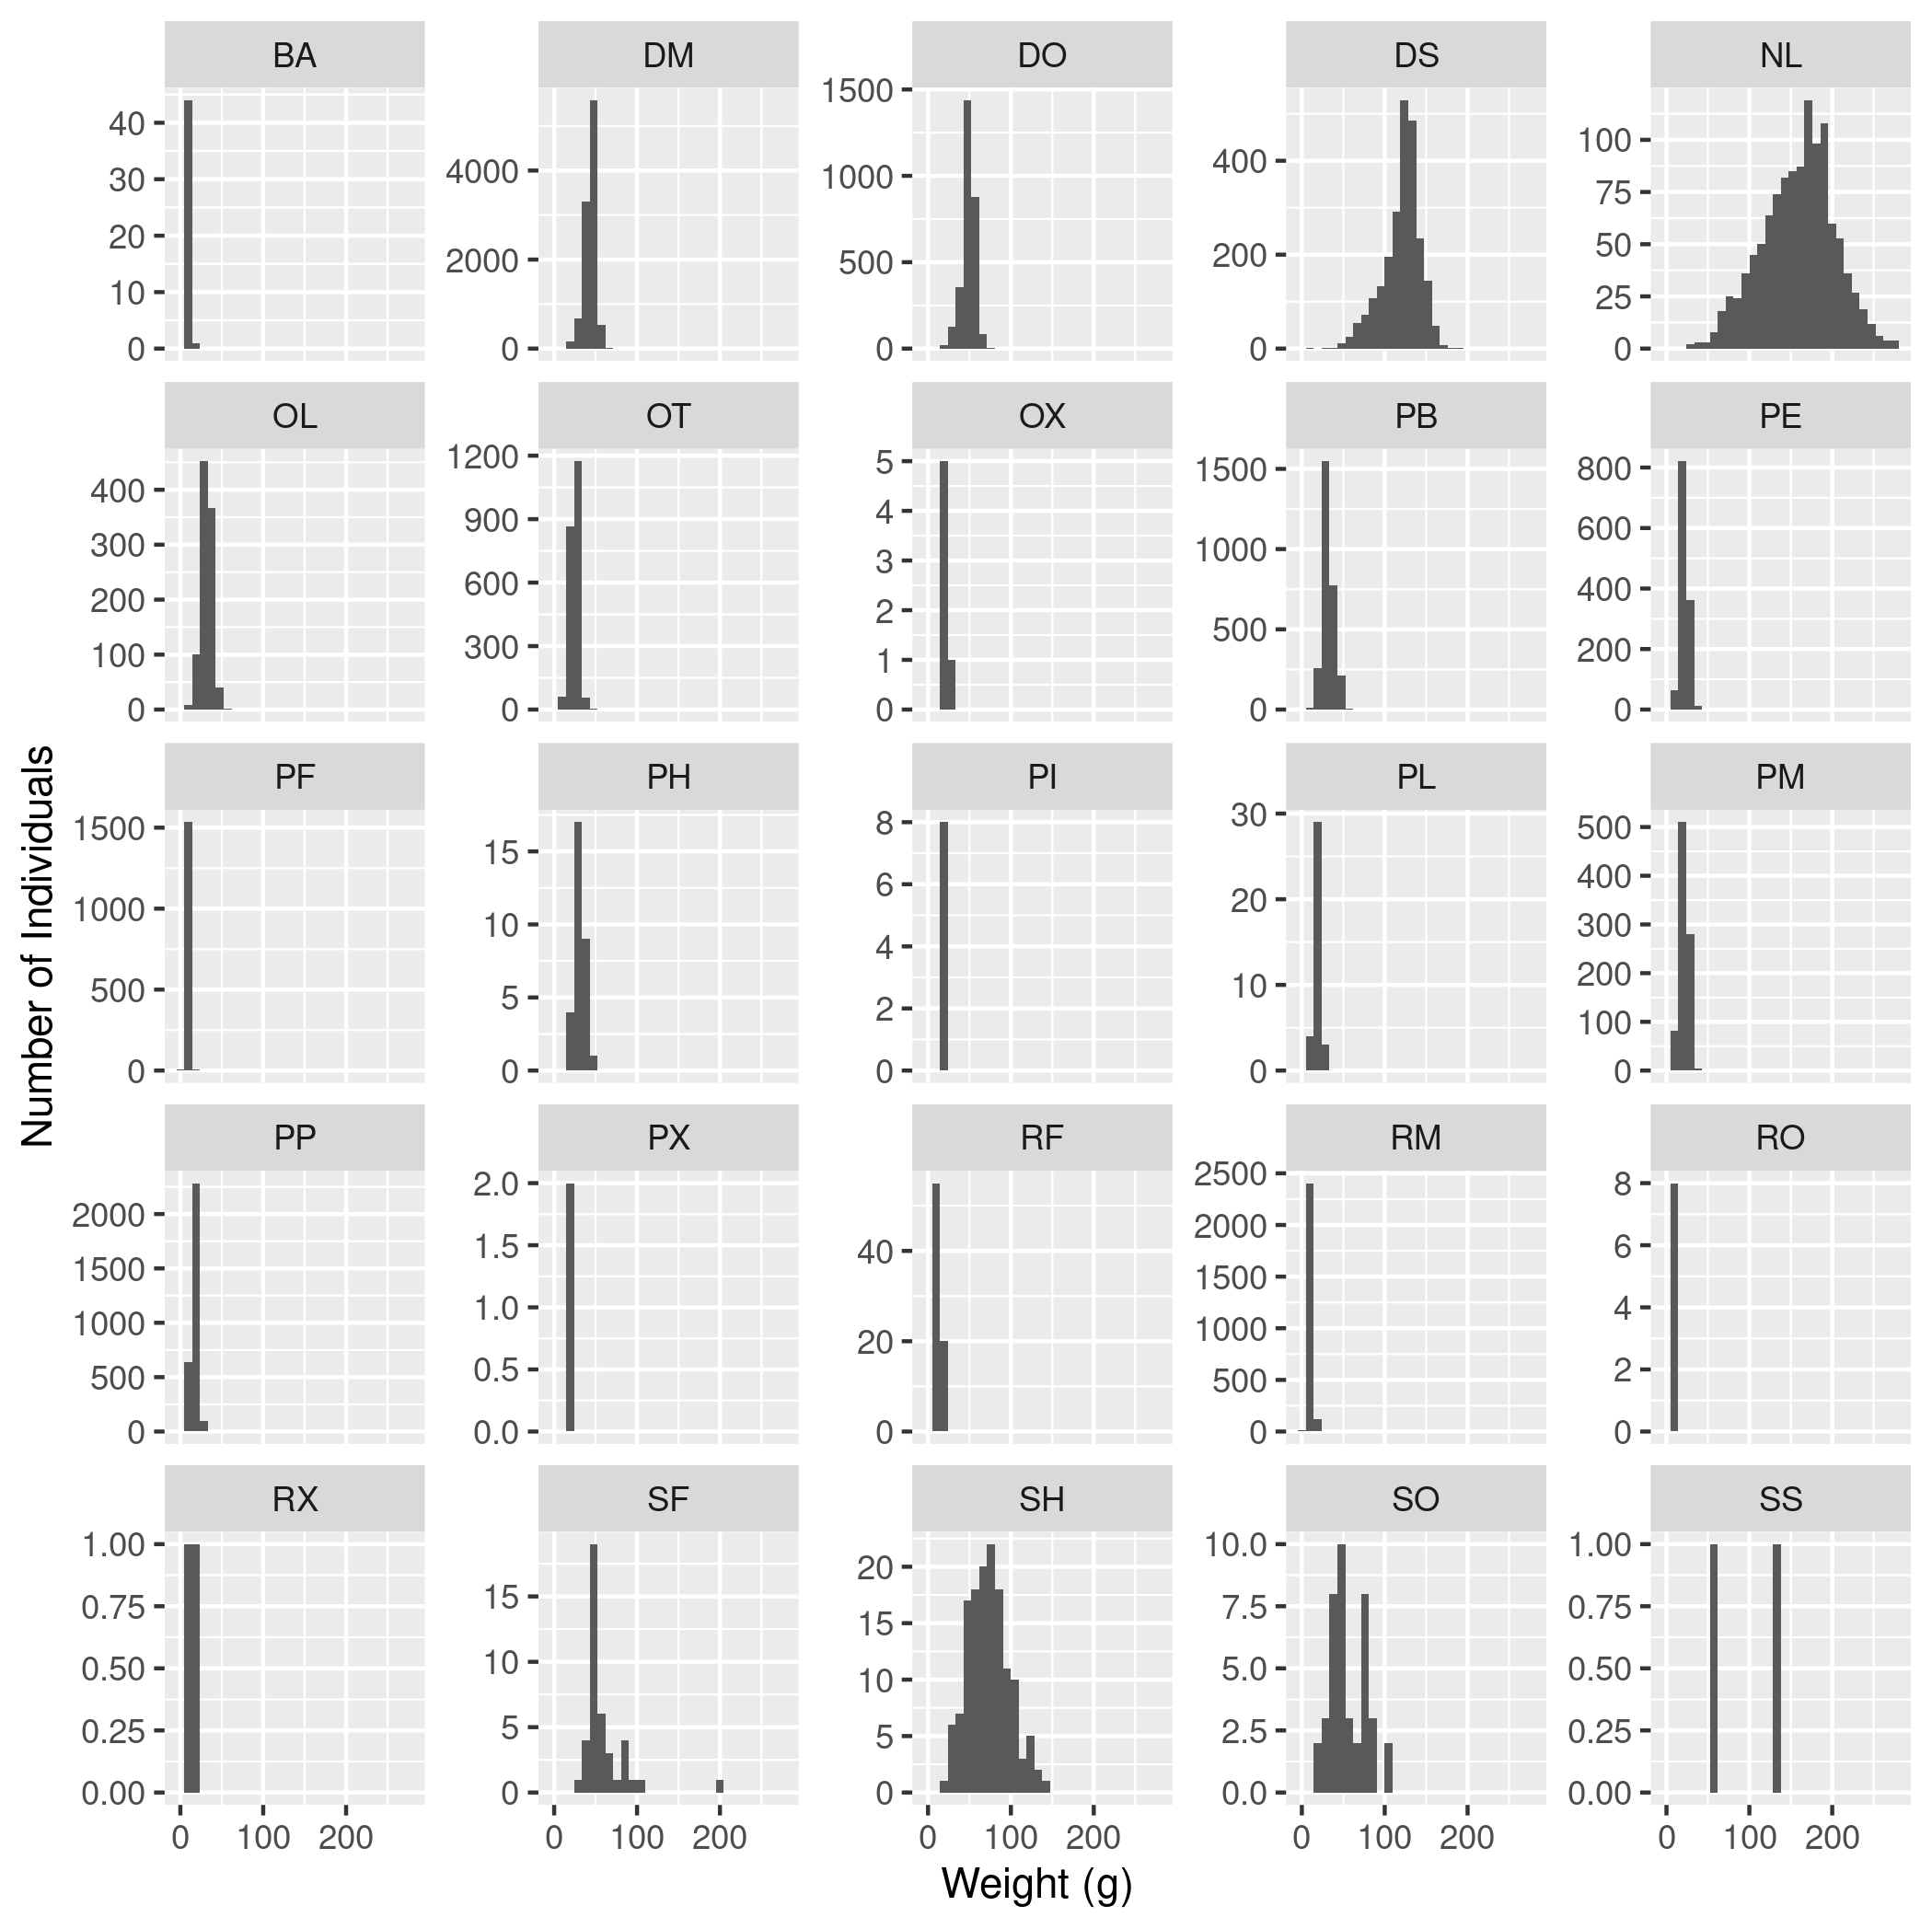
weighton the x-axis andhindfoot_lengthon the y-axis. Use alog10scale on the x-axis. Color the points byspecies_id. Include good axis labels. - Make a histogram of weights with a separate subplot for each
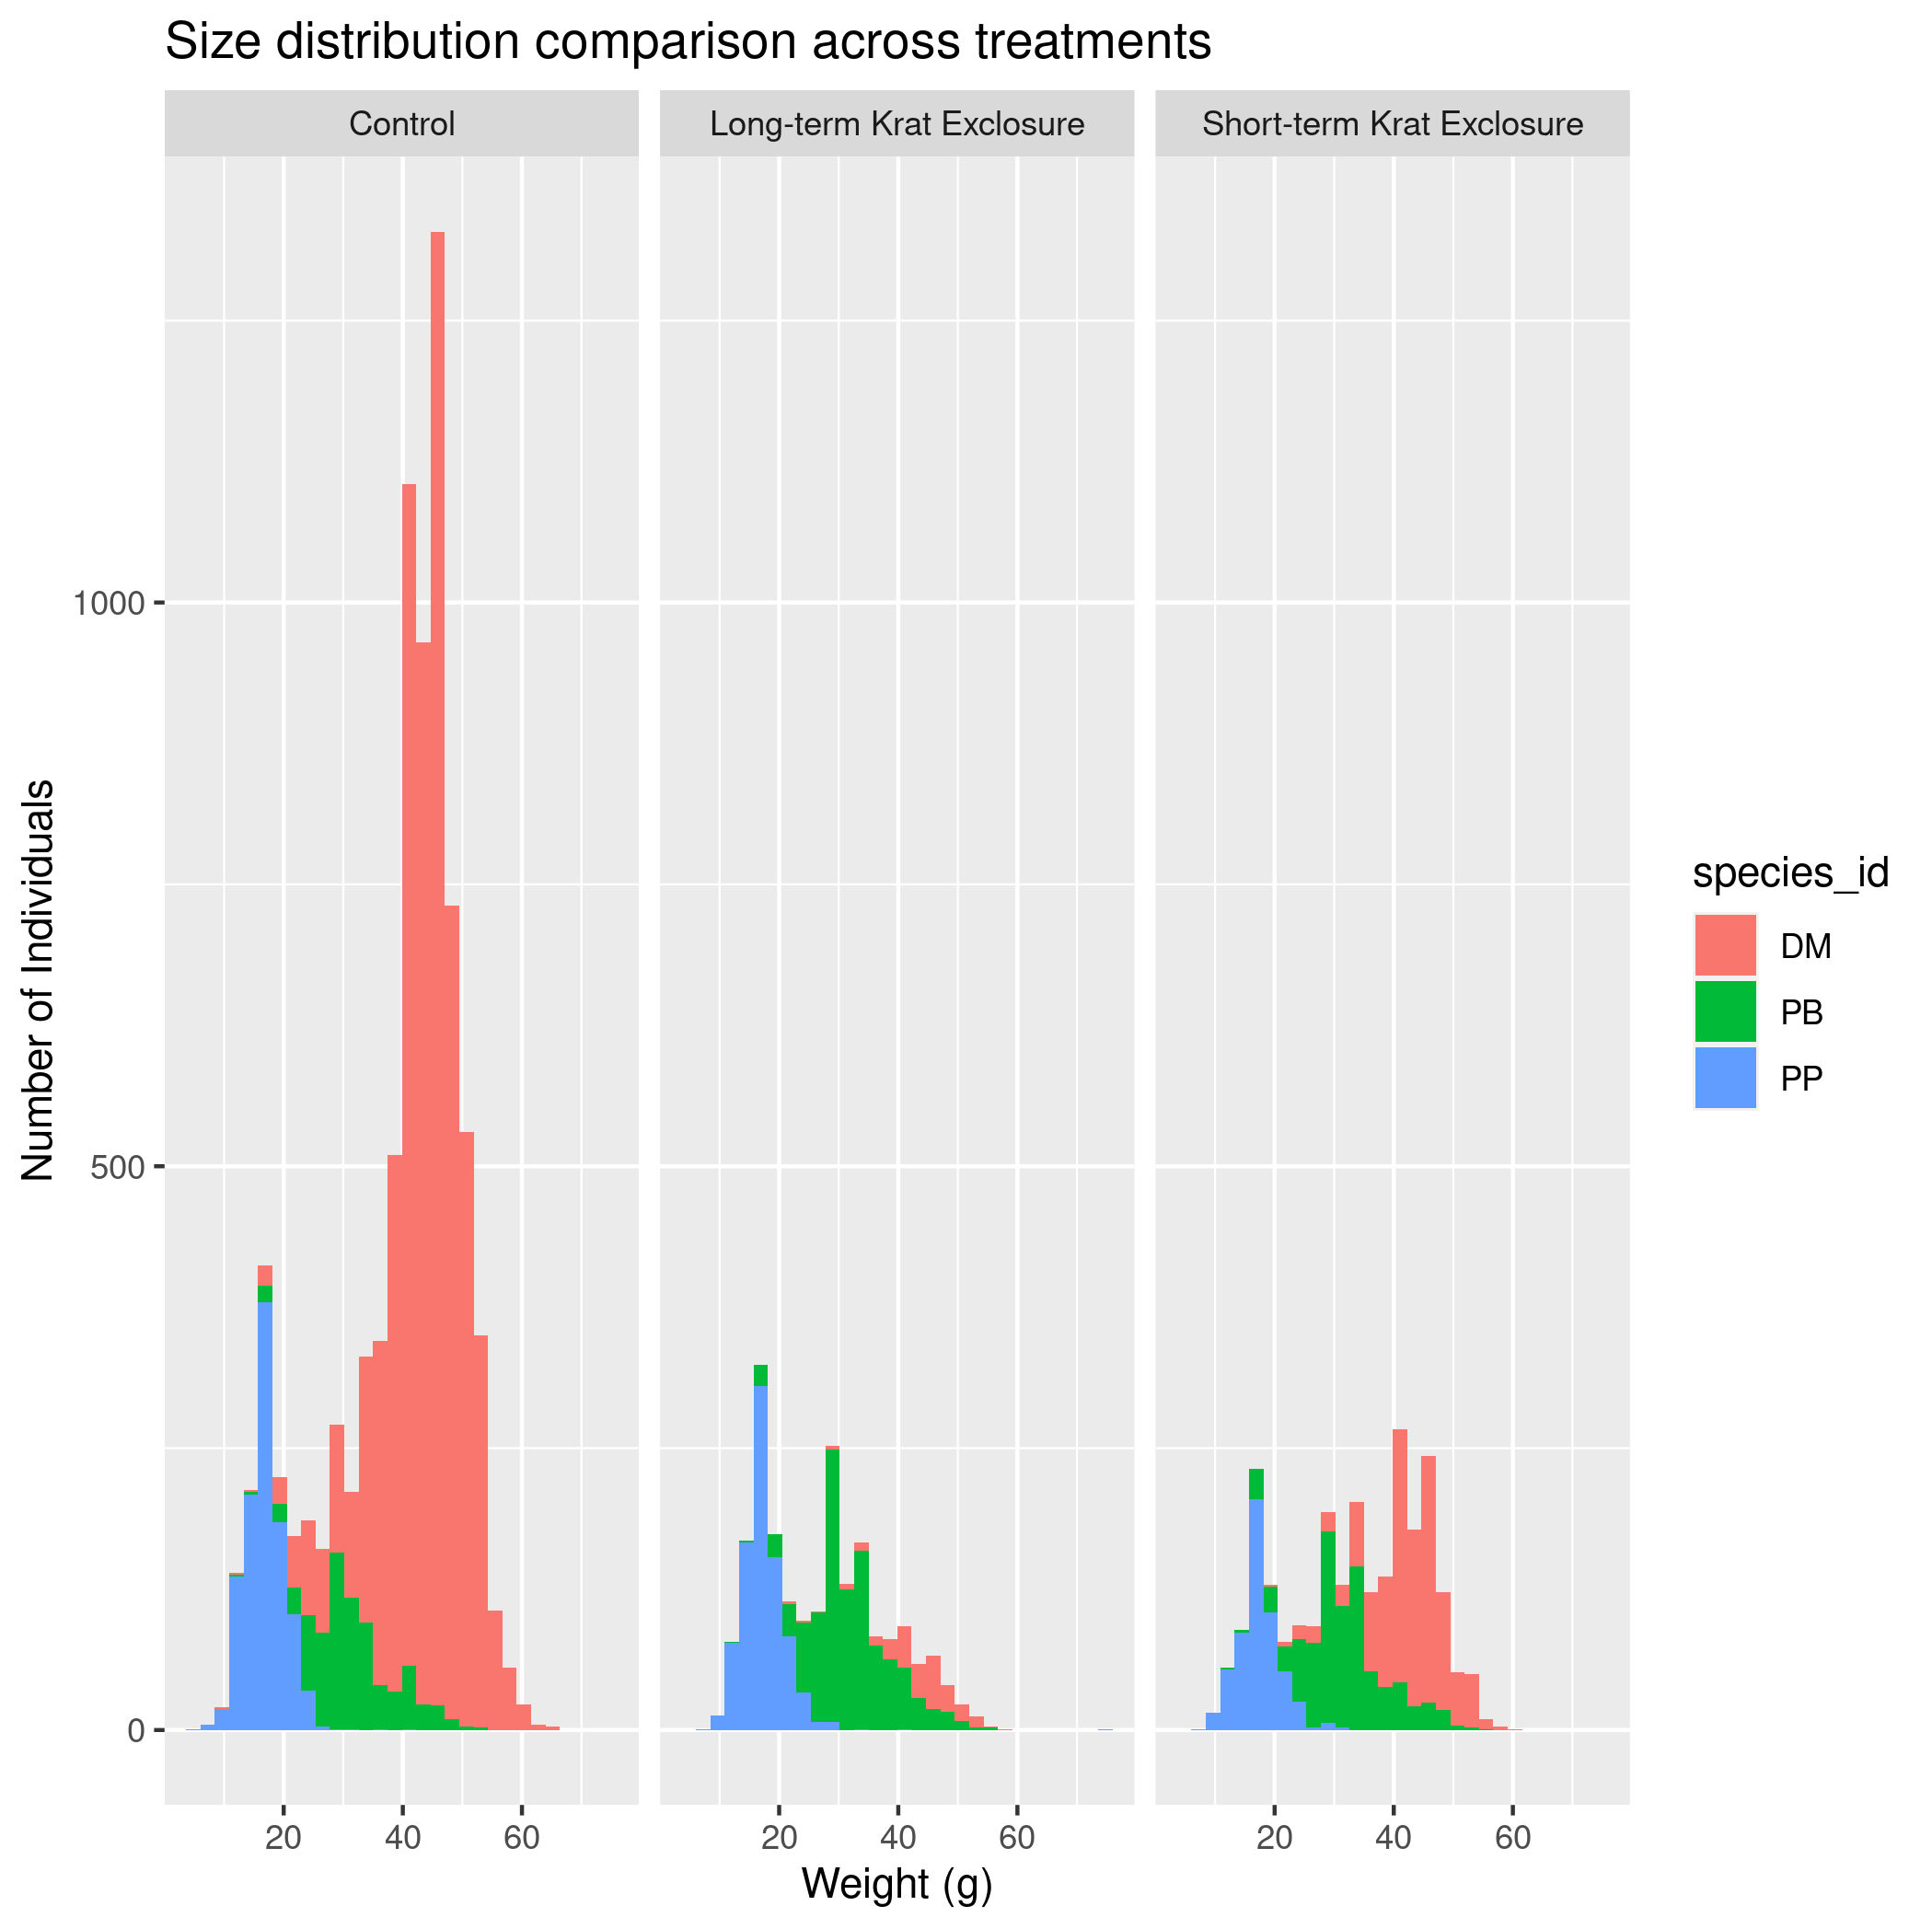
species_id. Do not include species with no weights. Set thescalesargument to"free_y"so that the y-axes can vary. Include good axis labels. - (Challenge) Make a plot with histograms of the weights of three species,
PP,PB, andDM, colored byspecies_id, with a different facet (i.e., subplot) for each of threeplot_type’sControl,Long-term Krat Exclosure, andShort-term Krat Exclosure. Include good axis labels and a title for the plot. Export the plot to apngfile.
- Create a data frame with only data for the